India Investment Opportunities Beyond Tier 1: Where the Next Phase of Growth Is Being Built
When European investors assess India investment opportunities, the conversation usually centres on Mumbai, Delhi and Bengaluru. These cities remain India’s economic anchors. Yet a growing share of the country’s entrepreneurship, consumption and corporate investment now takes place in cities that few European investors have visited, and whose scale is often underestimated. This article is written for professional investors considering an allocation to India. It explains what India’s city tiers mean, compares their size with familiar European cities, and sets out why Tier 2 and Tier 3 cities are becoming centres of talent and investment. It closes with what this shift means for investing in India, and where we see a gap between economic activity and the capital that follows it.

What are Tier 1, Tier 2 and Tier 3 cities in India?
There is no single official definition of city tiers in India. In this article, we classify cities by their current population, using the size classes of the United Nations’ World Urbanization Prospects 2025: Tier 1 refers to megacities of more than ten million inhabitants, Tier 2 to cities of one to ten million, and Tier 3 to cities of 250,000 to one million.1 On this basis, Hyderabad, Ahmedabad and Pune, often counted among the metros, appear as large Tier 2 cities.2
How big is a Tier 2 city? A European comparison
For readers who have not travelled to India, the scale of its cities is difficult to picture. India officially recognises 5 Tier 1 cities, 74 Tier 2 cities and 302 Tier 3 cities.2 Framing these tiers against familiar European benchmarks helps put their size into perspective:
- Tier 1: 5 cities with populations above 10 million; New Delhi alone is nearly three times the size of London.2
- Tier 2: 74 cities between 1 and 10 million; Kochi, at around 5.1 million, is close to Madrid’s 5.6 million.2
- Tier 3: 302 cities from 250,000 to 1 million; Haridwar is roughly the size of Zurich.2
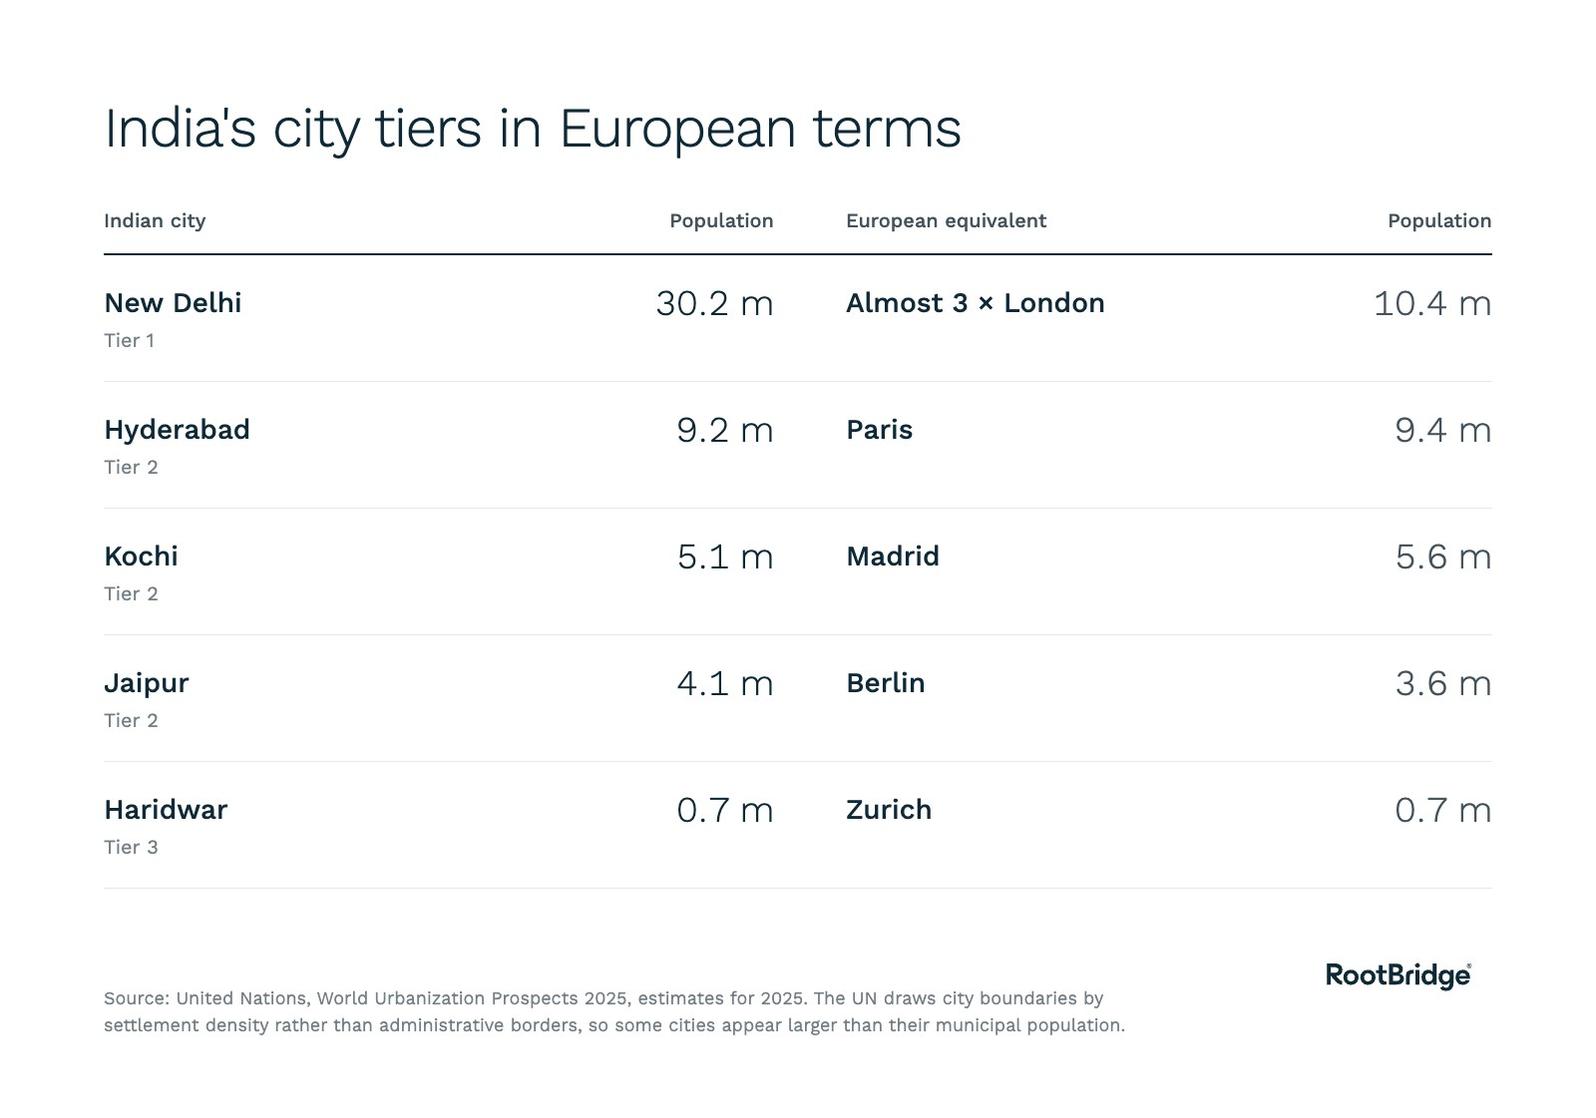
Table comparing the populations of Indian Tier 1, Tier 2 and Tier 3 cities with European cities of similar size. Source: United Nations, World Urbanization Prospects 2025, estimates for 2025.
Where consumption is growing beyond the metros
New businesses are already being created to serve India’s expanding middle class, and growth is increasingly driven by rising incomes and demand from Tier 2 cities and beyond. By 2030, more than 140 million additional households are expected to cross an annual income of USD 10,000, materially widening the pool of discretionary spenders across the country.3
This demand is being absorbed by a dispersed network of enterprises: around half of India’s registered small businesses are located in Tier 2 and Tier 3 cities, anchoring both supply and consumption in the metros and beyond. At the same time, e-commerce penetration remains low at just 6–8% of retail, versus 23–25% in the United States and 25–27% in China, implying substantial headroom as more consumers move online.3
Why Tier 2 and Tier 3 cities are becoming talent and investment centres
According to JLL, more than 90% of global capability centre (GCC) activity remains concentrated in established Tier 1 cities such as Bengaluru, Mumbai and Delhi. However, a growing number of Tier 2 cities, including Ahmedabad, Jaipur, Coimbatore, Lucknow and Kochi, are gaining ground as alternative locations for expansion.4
For companies, these cities offer cost advantages, improving infrastructure, government incentives and access to largely untapped talent pools. Organisations can potentially reduce real estate, talent and operating expenses by 25–50% compared with traditional Tier 1 hubs. For employees, these markets provide access to qualified jobs, a lower cost of living and a better work–life balance, due to shorter communtes. These advantages can help companies attract and retain talent, reduce turnover and generally enable more sustainable growth.4
International companies are already acting on this. In February 2026, Micron opened a chip assembly and test plant in Sanand, near Ahmedabad, representing a combined investment of about USD 2.75 billion by Micron and its government partners.5 Micron expects the project to create up to 5,000 direct jobs and 15,000 jobs in the local community over several years.6
For investors, the implication is clear: Tier 2 and Tier 3 cities are no longer simply consumption stories. They are increasingly becoming structurally attractive locations for talent, business operations and long-term capital deployment.
Proving the business model before scaling
In our experience, some of the most disciplined founders do not start in Mumbai or Bengaluru. They start in a smaller city, where rents, salaries and customer acquisition cost less, and where a business model can be refined before it faces the competition of the metros.
One of our portfolio companies, Foodsta Kitchens, illustrates this. Foodsta is a Singaporean-Indian food and beverage group that follows a house-of-brands approach, combining physical outlets with cloud kitchens: delivery-only kitchens from which several virtual brands can be run at the same time. Because the brands share many of their ingredients, a single kitchen can serve several of them efficiently.
One of these brands, Nasi & Mee, began under a different name, Noodle King, in Kochi. There, the team tested and refined the concept at a lower cost base before taking it to Bengaluru, one of India’s most competitive consumer markets.
Smaller cities are not necessarily easier markets. What they offer is a lower cost of learning, so that founders arrive in the metros with a model that has already been refined.
Investing in India beyond the metros: activity has spread, capital has not yet
Measured against this activity, private capital remains concentrated. According to Crisil and Oister Global, the share of private equity and venture capital deal value in cities outside Tier 1, as Crisil defines it, rose from 0.3% in fiscal 2015 to 3% in fiscal 2025.7 That is a tenfold increase, but from a very low base: while around half of India’s startups now come from beyond the metros8, around 97% of PE and VC deal value is still invested within them.
In our view, this gap defines one of the more interesting India investment opportunities for professional investors. Many of the businesses serving this demand are small and medium-sized, unlisted and founder-owned. As we set out in our comparison of India ETFs and private equity, they are largely absent from public indices, and they are not yet the focus of most private capital. Reaching them requires local networks, patience and on-the-ground diligence.
What this means for investors
The developments described in this article belong to a broader trend. Urbanisation is one of the three structural forces behind our investment thesis, alongside the digitalisation and the organisation of India’s economy. According to the UN, the number of Indian cities with at least 50,000 inhabitants rose from 894 in 1975 to 2,054 in 2025, and the number of people living in them from around 180 million to around 590 million, almost four times as many as live in all the cities of the European Union combined. By 2050, India’s cities are projected to add a further 150 million people.2
This growth is no longer concentrated in a handful of megacities. Cities the size of Madrid are developing their own consumer markets, talent pools and company ecosystems, and many of the businesses growing there cannot be reached through listed markets.
RootBridge’s founders have been investing across India’s private and public markets since 2008. Their experience includes identifying companies that leverage the cost advantages of Tier 2 and Tier 3 cities to build scale and/or expand into markets beyond Tier 1.
To discuss the opportunity beyond Tier 1, request a meeting with the RootBridge team.
Sources
1. United Nations, DESA Population Division (2025). The World’s Cities in 2025: Data Booklet (World Urbanization Prospects 2025). https://www.un.org/development/desa/pd/sites/www.un.org.development.desa.pd/files/undesa_pd_2025_data-booklet_world_cities_in_2025.pdf
2. United Nations, DESA Population Division (2025). World Urbanization Prospects: The 2025 Revision, Online Edition. City population data (cities with 50,000 inhabitants or more) and population by size class of cities, estimates for 2025. https://population.un.org/wup/downloads?tab=Cities
3. McKinsey & Company (2026). The great unbundling of Indian e-commerce: MSMEs and the direct-to-consumer revolution. February 2026. https://www.mckinsey.com/industries/logistics/our-insights/the-great-unbundling-of-indian-e-commerce-msmes-and-the-direct-to-consumer-revolution
4. JLL (2026). Beyond metros: the tier-two emergence (India GCC Guide 2026). https://www.jll.com/en-in/insights/beyond-metros-the-tier-two-emergence
5. Micron Technology (2026). Micron Celebrates Opening of India’s First Semiconductor Assembly and Test Facility. Press release, 28 February 2026. https://investors.micron.com/news/press-release/2026/Micron-Celebrates-Opening-of-Indias-First-Semiconductor-Assembly-and-Test-Facility-02-28-2026/default.aspx
6. Micron Technology (2023). Micron Announces New Semiconductor Assembly and Test Facility in India. Press release, 22 June 2023. https://investors.micron.com/news-releases/news-release-details/micron-announces-new-semiconductor-assembly-and-test-facility
7. Crisil; Oister Global (2026). No Ifs About AIFs, Edition III, p. 21. https://oisterglobal.com/reports/no-ifs-about-aifs-3/
8. Press Information Bureau, Government of India (2026). A Decade of Startup India. 15 January 2026. https://www.pib.gov.in/PressReleasePage.aspx?PRID=2214872®=3&lang=2
Get your newsletter.
Never miss a chance to unlock insights and opportunities in the world’s fastest-growing economy. Sign up for our newsletter today.


Thank you for signing up
You're officially on the list. Fresh updates, insider news, and exclusive content are headed your way. We're glad to have you with us!